
Klarna IPO vs Afterpay vs Affirm - Which Stock to Buy? (December 2021 Update)
(December 2021 Update) Klarna's financing round in June 2021 valued it at $45.6b. This can be derived by using a number of metrics.
Market Value
Klarna's market value can be derived based on a number of metrics.
A) Total cashless transactions, which according to Klarna's H1'21 Investor Presentation below is about $7t.
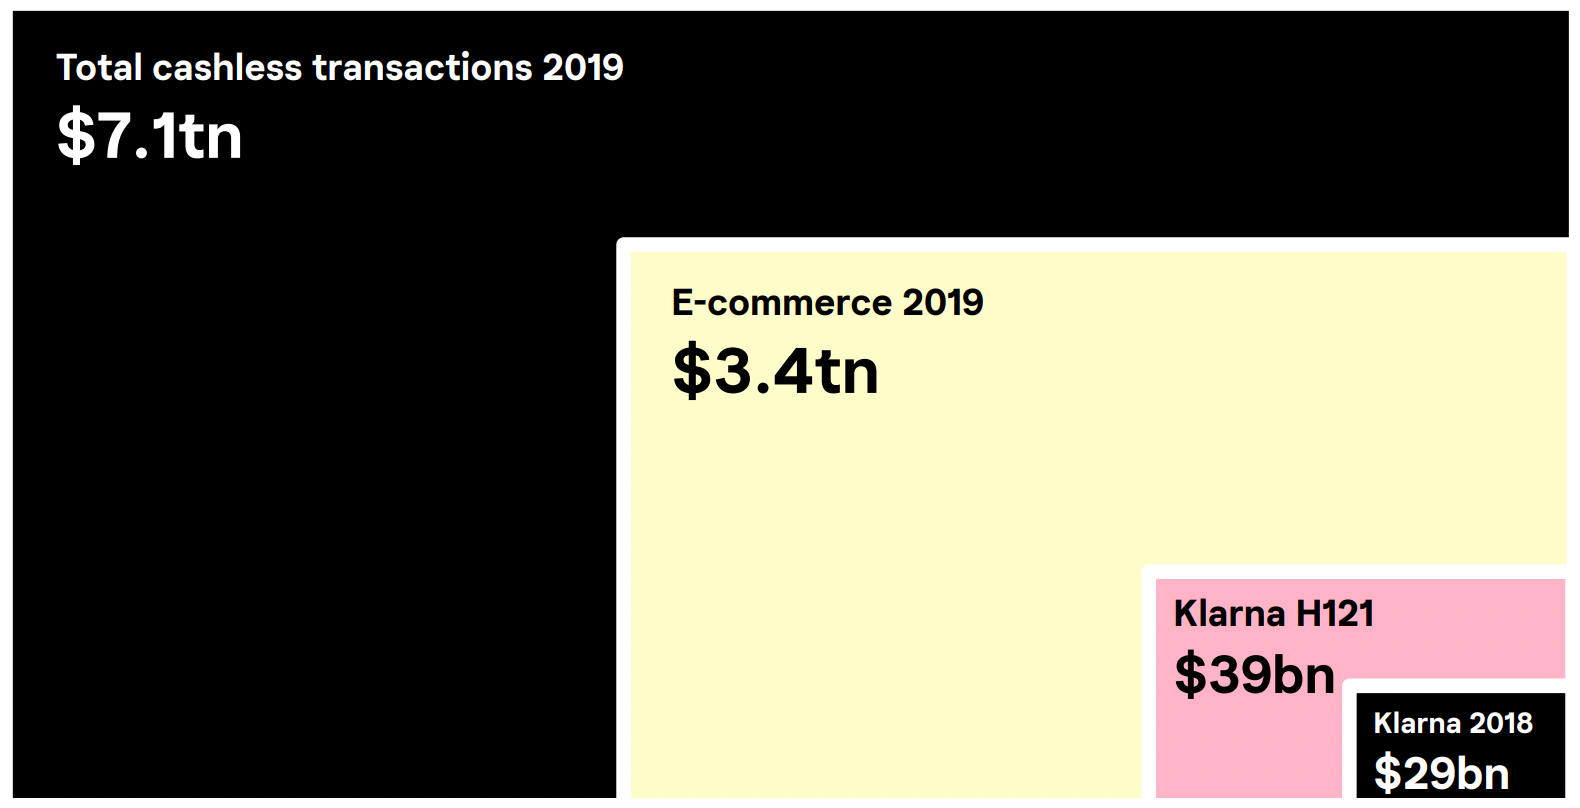
Of which, total e-commerce transactions is about $3.4t.
In another report from Worldpay, "global e-commerce transactions totaled $4.6 trillion in 2020, up 19% from 2019".
B) Klarna's market share
Annualizing Klarna's Q3'21 GMV gives $76b or ~1.7% of the above global e-commerce transactions market share.
According to the aforementioned Worldpay report, "BNPL accounted for 2.1% of global e-commerce transactions, or ~$97b."
This implies Klarna is ~80% of the BNPL market so it is unlikely to grow significantly more by taking market share. Rather, its growth will be dependant on BNPL's share of the total cashless transactions and its growth, which according to the Worldpay report, "BNPL as % of global e-commerce is expected to double to 4.2% by 2024."
C) Klarna's margin, which is proxied by its total net operating income as % of GMV and is calculated to be 1.87%.
Note that this figure for one of Klarna's competitor, Affirm, is around 10%.
D) Market Value to Total net operating income
A reference is Affirm's figures, which has a market cap of ~$35b and total net operating income of $1.1b (Q1'22 annualized). This gives a multiple of around 32x. (However, as discussed above, given Affirm's seemingly much higher margin, should Klarna and Affirm share similar multiples?)
Multiplying A, B, C and D gives a market value of ~$46b.
Klarna's financing round in June 2021 valued it at $45.6b.
Our Members' section has a spreadsheet that changes the size of the global e-commerce transactions and Klarna's market share to see the potential impact on market value. Email [email protected] for details.
Klarna's Interest Rates
A number of operating metrics can be calculated using data from Klarna's Q3'21 Results Presentation.
Dividing interest income by loans to the public gives an annualized yield of 8.3%. This compares with Affirm's ~17-25%.
Klarna's rate appears low as suggested by its US and UK websites.
According to its 2021 Interim Report, Germany and Sweden accounted for 35% and 20% of total revenue, respectively. Klarna's other operations are predominately in European countries such as Austria, Belgium, Denmark, Finland, the Netherlands, Norway and Switzerland. Perhaps this is part of the reasons why rates are lower.
Meanwhile, Klarna is experiencing strong growth and taking market share in the US as per its H1'21 presentation.
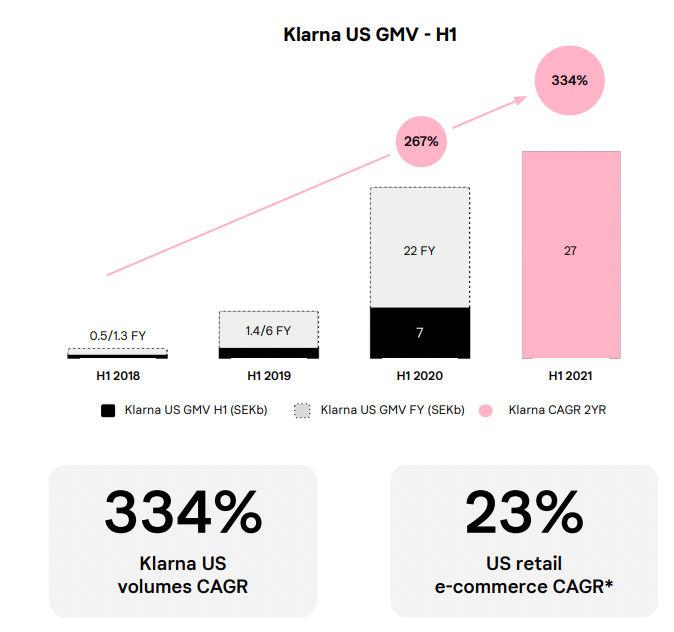
Could this lead to a rise in the interest rates as well?
Another question is how are the assets funded in different geographies by the liabilities? For example, can a deposit in Sweden fund a loan in the US?
As per the revenue breakdown below,
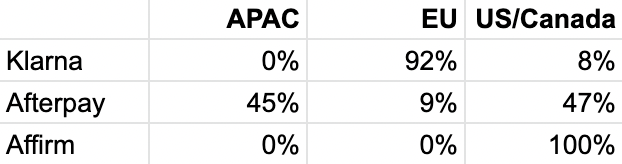
Klarna (founded in Sweden) is predominately an EU business though its US exposure is rising. Afterpay (headquartered in Melbourne) has more APAC exposures though EU and the US will become more important (especially after Square's acquisition). Affirm (headquartered in Silicon Valley) is predominately US (98.5%) and Canada (1.5%).
Moving on to the Funding Cost, which is calculated by dividing interest expense by the sum of Deposits from the public and Debt securities issued gives an annualized rate of 1.7%.
This implies an interest rate spread of 6.6%. As a comparison, Bank of America's net interest margin is around 2.5%. The higher spread is due to Klarna's predominately personal loan exposure, which should have limited collateral. Whereas, traditional banks like Bank of America's loans have more collateral in commercial loans and mortgages etc.
Operating Metrics Comparisons
Using disclosures from the investor relations section of websites of Klarna, Afterpay and Affirm, we compile and compare some of their key operating metrics.
GMV
Klarna is the clear leader in terms of GMV but is growing slightly slower than Afterpay and Affirm. Assuming the same growth rates, it would take Afterpay 8 years to catchup to Klarna.
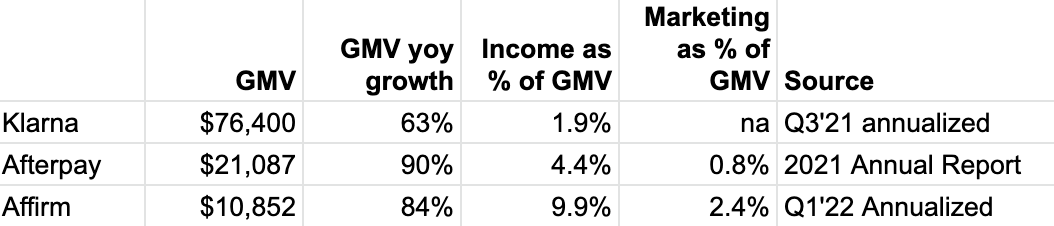
Klarna's income to GMV is lower than Afterpay and Affirm. This is partly attributable to its lower interest rates and lower fees from merchants.
Will industry dynamics lead to lower fees for Afterpay and Affirm? While this may imply lower margins hence multiples, investors appear indifferent and valuing these businesses at similar multiples.
Affirm's marketing spend to GMV is more than Klarna's income to GMV, which implies Affirm's marketing spend to GMV should fall over time.
In absolute terms, Affirm is spending 52% more than Afterpay in marketing.
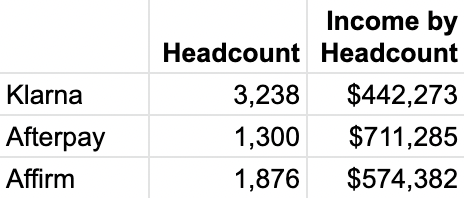
Headcount
In terms of headcount, Afterpay is 40% and Affirm is 58% of Klarna. Afterpay's income by headcount is the highest.
Loss Provision
Klarna's loss provision expense to income is higher than Afterpay and Affirm but the loss provision expense to loans is lower.
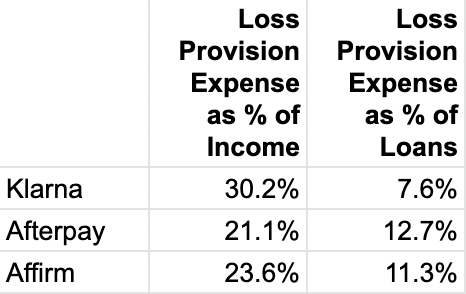
This means that Klarna is provisioning less than Afterpay and Affirm, which may be due to better risk taking or simply less provisions.
If default rates rise, the higher loss provision expense to income may also imply Klarna's income to be impacted by more than Afterpay and Affirm.
Return on Capital
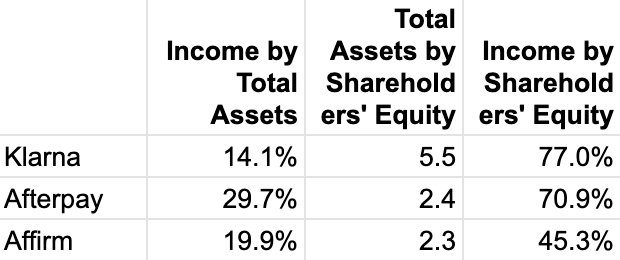
Afterpay has the highest Income by Total Assets implying it is the least asset intensive or specifically, it derives more income from fees than loans.
Klarna has the highest Asset to Equity, which means it is carrying more assets with the same amount of shareholders' capital. In other words, more leverage.
This results in Klarna and Afterpay having similar Income to Equity.
With Klarna's potential IPO, its shareholders' equity will rise hence lowering the leverage and Income to Equity.
Related Articles
Peter Thiel portfolio - Affirm Stock Analysis (November 2021 Update) - https://www.whichequities.com/affirm-afrm-stock/
Upstart Stock Analysis (November 2021 Update) - https://www.whichequities.com/upstart-upst-stock/