Big Short (Stocks to Sell) DraftKings (DKNG Stock) analysis - loses more than $1b a year, with $2b cash and worth $17b (February 2022 Update)
(February 2022 Update) Even if DraftKings does not spend anything on sales and marketing and product and technology, just the general and admin expenses make the business unsustainable.

As per DraftKings' Q3 2021 Presentation, while it is growing >30% in terms of both users and revenue per user,...
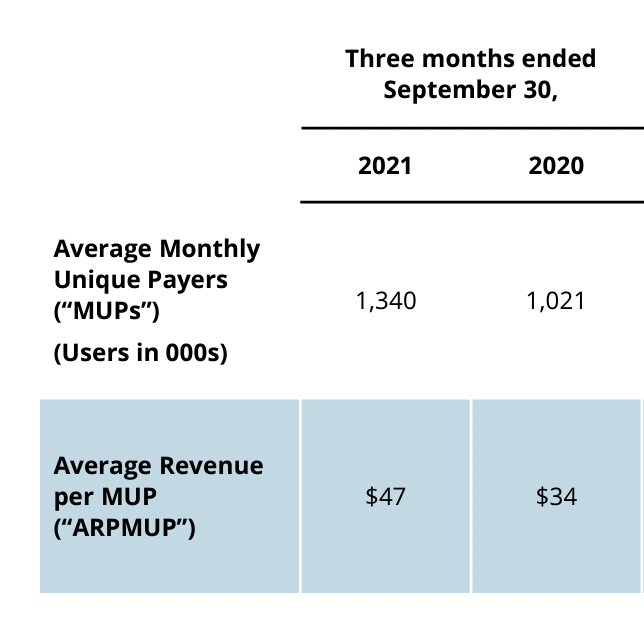
...it is not entirely clear this growth is profitable as its loss from operations were $546.5m for the quarter.
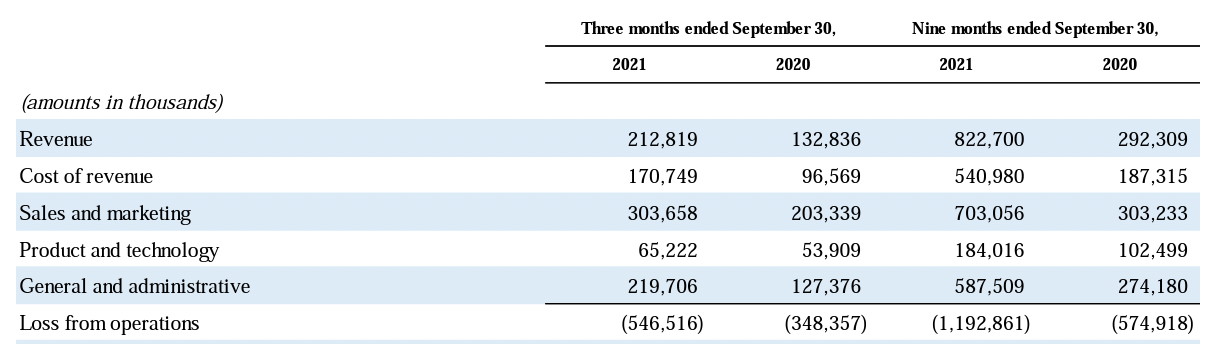
Specifically, it has gross margin of ~20% so a gross profit of $42m during the quarter. However, its expenses are $589m in total.
These figures are bewildering as even if DraftKings does not spend anything on sales and marketing and product and technology, just the general and admin expenses make the business unsustainable.
Therefore, is the money invested in sales and marketing and product and technology creating negative returns?
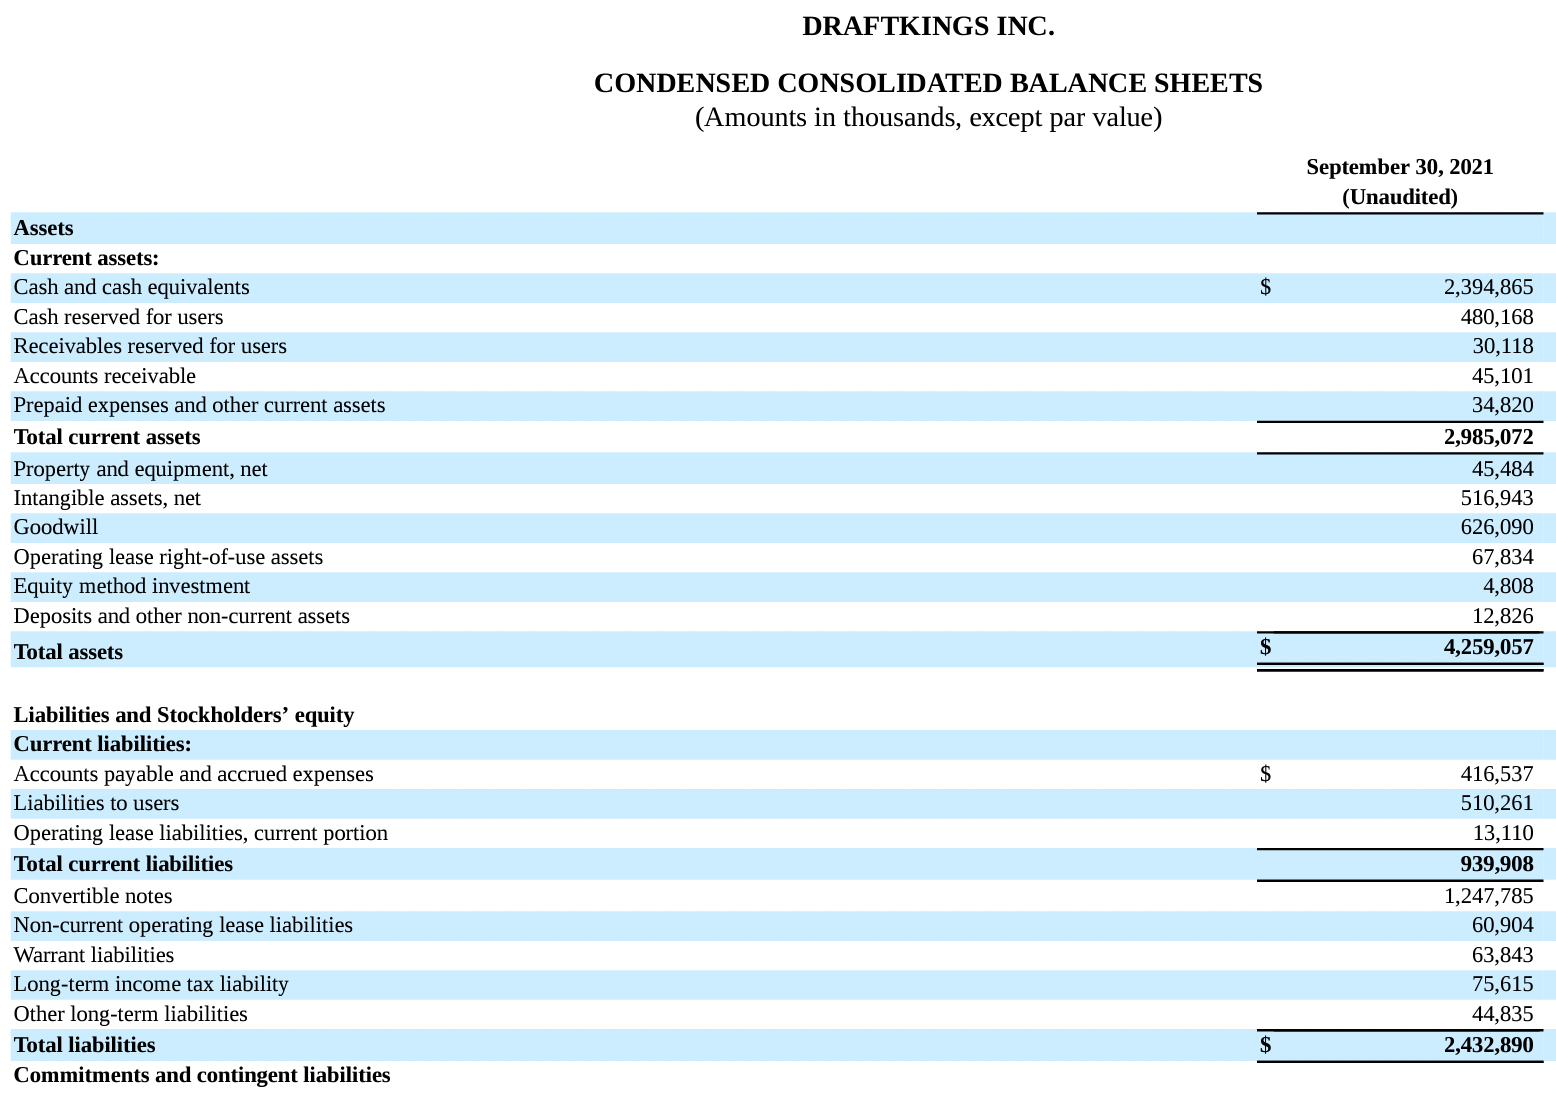
As per its Q3 2021 10Q, it still has cash of $2.4b, implying this cash burn can still sustain for at least 2 more years even without refinancing.
As reference, the below are definitions of DraftKings' Cost of revenue and Sales and Marketing from its prospectus S-1.
Cost of revenue. Our cost of revenue consists primarily of variable costs. These include mainly (i) payment processing fees and chargebacks, (ii) product taxes, (iii) platform costs and (iv) revenue share / market access arrangements.
We incur payment processing costs on user deposits and occasionally chargebacks as a result of user complaints (chargebacks have not been material to date).
Product taxes are imposed by different jurisdictions, typically as a percentage of our gross gaming revenue, and also include, to a lesser extent, federal excise and local sales taxes on certain product offerings. Product taxation of online sports betting and iGaming can vary substantially across jurisdictions, and we expect this to become an increasingly significant driver of our cost of revenue as we enter new jurisdictions. Product taxes may also reflect state promotional tax credits, which are recorded as an offset to the cost of revenue.
Platform costs relate mainly to third-party integrated platform services, such as Kambi’s sportsbook platform, data fees for information feeds and geolocation services, web hosting, amortization of capitalized software development costs and developer salaries. These platform costs can vary substantially depending on the mix of product offerings. For example, our iGaming offerings consist of a combination of games we have built ourselves, with no license fees payable to content suppliers, and licensed content from third-party suppliers subject to various arrangements based on revenue sharing or levels of activity. The games in our iGaming offering that we developed in-house, such as blackjack, result in higher margins than games subject to licenses.
Revenue share arrangements are mainly agreements with land-based casinos in states that require these agreements in order to provide real-money online sports betting and iGaming offerings (“market access”). These market access fees are driven mainly by the levels of paid user activity via our platform, particularly engagement with our Sportsbook and iGaming offerings, in a given period.
Sales and Marketing. Sales and marketing expenses consist primarily of direct advertising costs, expenses associated with strategic league and team relationships, brand and creative services and related personnel costs. Sales and marketing also includes, to a lesser extent, costs related to promotional contests funded entirely by us and allocations of rent, maintenance and utilities costs according to headcount.
We consider our sales and marketing spend and promotional offers (which is contra revenue and is described under “— Key Components of Revenue and Expenses — Revenue” above) to be similar in character. Our total spend and allocation of spend between sales and marketing versus promotional spend offers on product launches varies based on local market conditions, regional synergies and competition, among other factors. For example, in New Jersey, we increased our sales and marketing spend upon launching our Sportsbook offering in the second half of 2018, in order to attract a critical mass of new paid users before returning to a normalized level in that market, while also providing promotional offers to our existing DFS users in that state to encourage use of our Sportsbook and iGaming offerings. We expect our advertising spend, like our promotional offers, to be a key component of our geographic expansion. Over the longer term, assuming the trend of mobile sports betting and iGaming legalization continues, we expect our sales and marketing spend to decline as a percentage of revenue, both as a result of higher return on each acquired paid user in multi-offering states (relative to states where only DFS is available) and improved purchasing scale.
Perhaps it is worth watching Warren Buffet's take on SPAC especially Charlie Munger's comments in the end. (DraftKings was listed via a SPAC in April 2020.)
You maybe interested in...
Big Short (Stocks to Sell) - LMND stock analysis (November 2021 Update)